For a presenter, the audience's reactions offer a wealth of feedback. It is easy to see whether the audience is interested and engaged. It's also easy to see whether the audience is bored and the presentation can barely hold their attention. The presenter generally understands their sentiment towards the presentation much better than any formal feedback collected afterward by observing the audience's reactions.
The insurance industry often experiences something similar. Formal customer satisfaction surveys or feedback requests usually result in a small fraction of their customer portfolio responding, leaving them guessing about the sentiment of the rest of the population. If it were possible for the insurer to observe customer behavior closely, they would be able to collect a lot of implicit feedback (to contrast it with the explicit feedback collected through surveys). Doing this would enable them to better understand the sentiment of their overall customer portfolio. This is precisely what SentiMeter® attempts to do.
How Does SentiMeter® Work?
SentiMeter® makes an educated guess about a customer's present sentiment towards the organization based on the following factors:
1. Direct Feedback from the Customer
This includes direct feedback provided by the customer through customer satisfaction surveys, NPS surveys, and potentially also through inbound calls. Direct feedback carries a high weightage in SentiMeter® calculation; and it is often the only data point used in traditional sentiment analysis techniques.
2. Customer's Actions
While direct feedback is undoubtedly useful, it's disadvantage is that it is available only for a small fraction of customers – which means it is not possible to understand the sentiment of the majority of insurance customers if one relies only on direct feedback. This is the reason SentiMeter® also makes use of events in a customer's journey where although the customer does not offer direct feedback, their actions can give us visibility into their sentiment. To understand how the impact of an event is considered, let us look at the example of premium payment. If one thinks logically, a customer who always pays their premium on time is more likely to be satisfied with the insurer than one who doesn't pay on time, or even worse, does not pay at all. SentiMeter® makes use of this logic and extends it to all events in a customer's journey.
Some other examples of positive customer actions (adding to the SentiMeter® score) are repeat purchases and opting for automated payments. Examples of negative customer actions (reducing the SentiMeter® score) are lapsing or non-renewals and policy cancellations.
3. The Organization's Behavior Towards the Customer
Some events in the customer's journey are influenced more by the insurance carrier. An example of this event is closing of customer queries or requests. If queries are closed promptly or requests are closed successfully within the accepted turn-around-time, the customer is likely to carry a positive sentiment towards the carrier. On the other hand, if requests are rejected or closure of either queries or requests takes a long time, the customer is unlikely to happy. SentiMeter® uses this logic and extends it to all carrier-controlled events in the customer journey.
4. Effect of Environmental Factors
There are a few scenarios where even environmental factors which are not completely in the carrier's control can affect a customer's sentiment. Some examples of this are price changes at renewals and fund value of a customer's investment in market-linked policies. Price increases at renewal or reducing fund values are unlikely to increase the customer's sentiment level.
Further, SentiMeter® makes use of the following principles when creating the score:
- A customer's frame of reference changes over time
A customer who is already at a high positive sentiment is likely to continue expecting a good experience and may not appreciate the next positive event with the same intensity as compared to a customer with a low sentiment level.
- No news is not likely to be a good news
As an optional feature, future versions on SentiMeter® will allow the score to decrease over time when there are long silent periods (when there are no events in the customer journey).
All the events experienced by a customer are combined into a single customer-level SentiMeter® score that is standardized between 0 to 100 for easy consumption.
Illustration
Consider the hypothetical example of John Doe, who became a customer of ABC Insurance Company on January 1, 2021 by purchasing an auto policy. Subsequently, he purchased a home policy with ABC Insurance Co on March 3, 2021. On May 15, 2021, he canceled the auto policy, and within the next month, on June 7, 2021, he responded to a customer satisfaction survey negatively (as a detractor); however, on March 2, 2022, he renewed his home policy and continues to be a customer of ABC Insurance Company today. SentiMeter® score variation for John Doe is shown below.
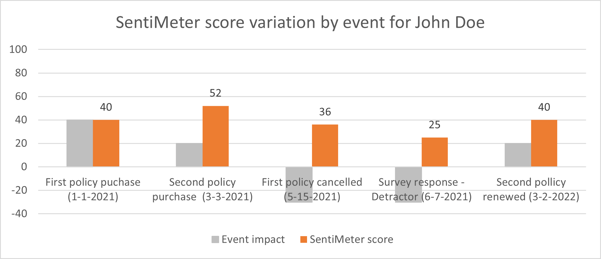
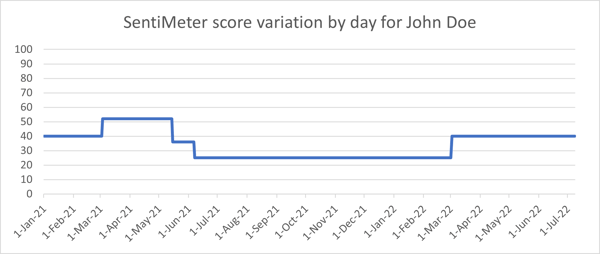
Notice that SentiMeter® score updates at each event to more accurately reflect the customer's sentiment. Notice also that even though policy cancellation and detractor survey response events have the same magnitude of negative impact, the change in overall SentiMeter® score at those two events is different due to the fact that the existing frame of reference for the customer is different when each event occurs.